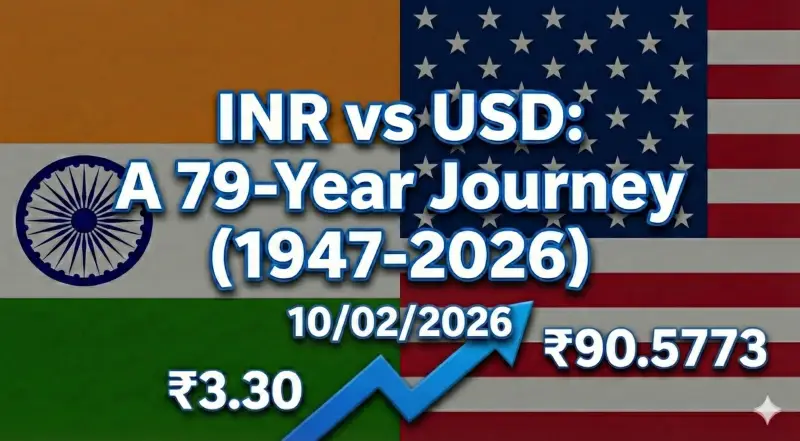
📈 The Rupee’s Journey: 1947 - 2026
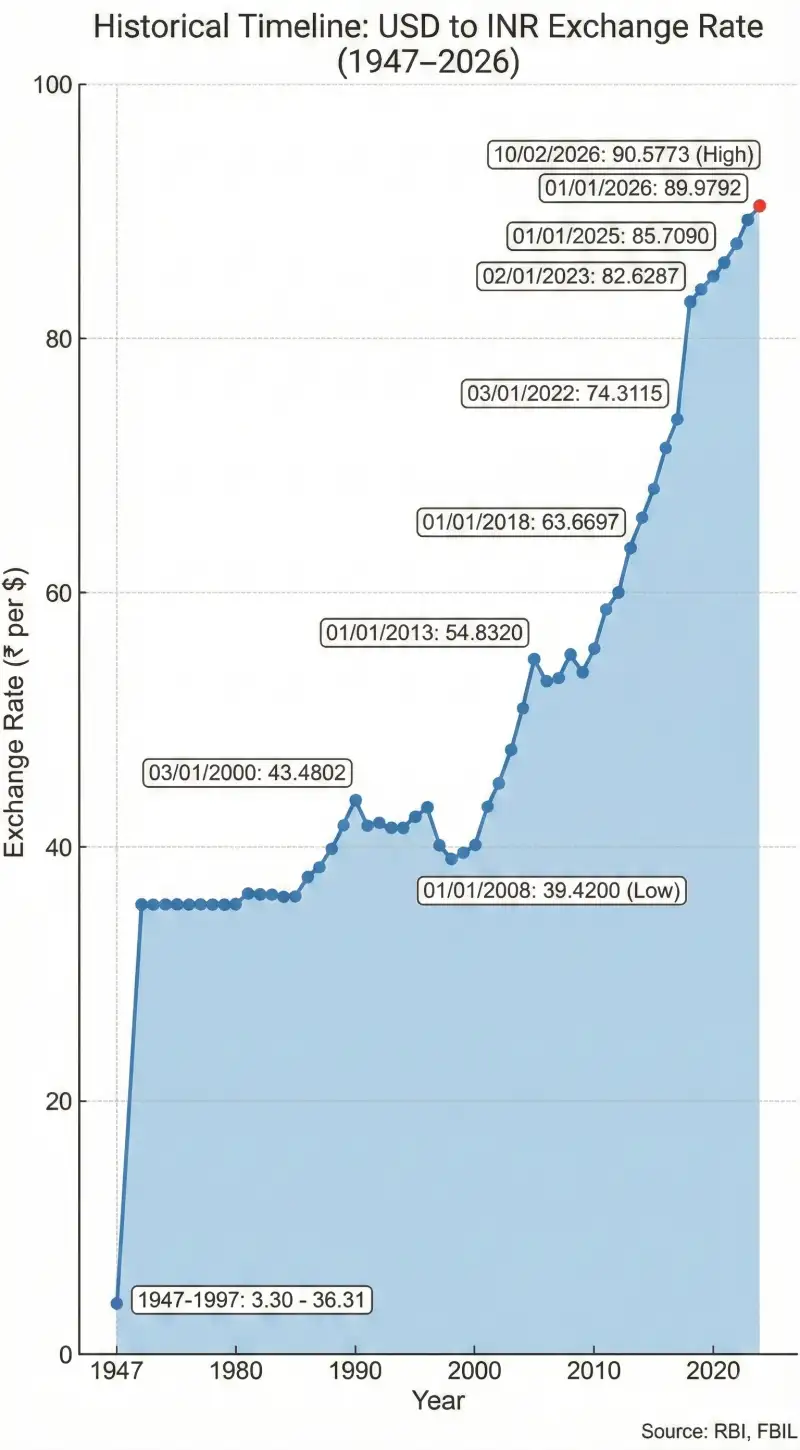
The history of the Indian Rupee is a reflection of India's economic evolution. Starting at approximately ₹3.30 per Dollar at independence (pegged to Pound), the currency has navigated wars and global crises to breach the ₹90 mark in February 2026.
1947 Start
₹3.30
Pegged to British Pound
1991 Crisis
₹25.00
Major Devaluation
2026 Today
₹90.58
All Time Low
📱 Virtual Currency Feed
Scroll through the timeline below to see how the value of $1 USD has changed in Indian Rupees.
Date Recorded
1 USD = ? INR
10 Feb 2026
90.5773
01 Jan 2026
89.9792
31 Dec 2025
89.9198
01 Jan 2025
85.7090
31 Dec 2024
85.6232
01 Jan 2024
83.1975
29 Dec 2023
83.1164
02 Jan 2023
82.6287
30 Dec 2022
82.7862
03 Jan 2022
74.3115
31 Dec 2021
74.3025
01 Jan 2021
73.0328
31 Dec 2020
73.0536
01 Jan 2020
71.3717
31 Dec 2019
71.2740
01 Jan 2019
69.7131
31 Dec 2018
69.7923
01 Jan 2018
63.6697
29 Dec 2017
63.9273
02 Jan 2017
68.0225
30 Dec 2016
67.9547
01 Jan 2016
66.1780
31 Dec 2015
66.3260
01 Jan 2015
63.3213
31 Dec 2014
63.3315
01 Jan 2014
61.9335
31 Dec 2013
61.8970
01 Jan 2013
54.8320
31 Dec 2012
54.7773
02 Jan 2012
53.2975
30 Dec 2011
53.2660
03 Jan 2011
44.6700
31 Dec 2010
44.8100
01 Jan 2010
46.6500
31 Dec 2009
46.6800
01 Jan 2009
48.7300
31 Dec 2008
48.4500
01 Jan 2008
39.4200
31 Dec 2007
39.4100
02 Jan 2007
44.2000
29 Dec 2006
44.2300
02 Jan 2006
45.0500
30 Dec 2005
45.0700
03 Jan 2005
43.6100
31 Dec 2004
43.5800
01 Jan 2004
45.6100
31 Dec 2003
45.6100
01 Jan 2003
47.9900
31 Dec 2002
48.0300
01 Jan 2002
48.2400
31 Dec 2001
48.1800
01 Jan 2001
46.6600
29 Dec 2000
46.7500
03 Jan 2000
43.4802
30 Dec 1999
43.5199
01 Jan 1999
42.4701
31 Dec 1998
42.4809
25 Aug 1998
42.5007
1947 - 1997
3.30 - 36.31
💡 Why Does the Value Drop?
- 🛢️ Import Dependence: India buys 85% of its crude oil from other countries. We have to pay in Dollars, which increases demand for Dollars and lowers the Rupee value.
- 📈 Inflation: Prices in India generally rise faster than in the US. When a country has higher inflation, its currency value usually goes down over time.
- 🌍 Global Markets: When interest rates are high in the USA (like in 2026), investors prefer to keep money there, pulling money out of developing markets like India.
🙋 Frequently Asked Questions
Q1. Was 1 USD really equal to 1 INR in 1947?
No, that is a myth. In 1947, the Rupee was linked to the British Pound. The calculated rate was actually around ₹3.30 to ₹4.76 per USD.
Q2. Why did it touch ₹90 in 2026?
It is due to the US Dollar becoming very strong globally and India needing more Dollars to pay for oil imports.
Q3. Is a weak Rupee always bad?
Not always! Exporters (like IT companies and textile makers) actually earn more money when the Rupee is weak because they get paid in Dollars.
Data Source: RBI Database & Historical Forex Archives (Feb 11, 2026)
View Official Charts
View Official Charts